

| THD Measurement and Conversion |
| You have probably seen "Total Harmonic Distortion" figures, expressed in percent, applied as one measure of quality of audio gear. What does this mean, and how is it measured? |
| One of the ways of expressing the "goodness" of an amplifier or other device is to use a number, based on measurements at a given power output level, expressing its "Total Harmonic Distortion." If an amplifier or other device is given a pure sine wave (i.e. just one frequency) at its input, the signal at the output will never be an exact copy of the input. There will always be some deviation in the shape of the waveform, which can be expressed as a series of "harmonics" of the fundamental frequency. This number indicates the RMS voltage equivalent of total harmonic distortion power, as a percentage of the total output RMS voltage. Clear as mud? Let's say you've got a harmonic analyser or other way of determining the amount of each harmonic (such as an FFT spectrograph program on your computer). How do you convert these readings into a single THD figure, for comparison with other devices? Before we go much further, it bears pointing out that there is considerable (and very valid) criticism of the practise of a single THD number to define the goodness of an amplifier. There are several weaknesses to this approach: not all harmonics are equally discordant; even harmonics tend to be much less dissonant then odd ones; higher harmonics are generally considered more dissonant; and a percentage number does not necessarily relate to how the ear perceives sound and distortion. Furthermore, it only describes one "kind" of distortion, and says nothing about intermodulation, phase errors, or other anomalies in the audio signal. There have been attempts to redefine THD to give more "weight" to higher harmonics, and other refinements, but as far as I know the industry has not agreed on any of these modified specs. All that being said, a THD figure can be useful when combined with other specifications, such as IMD (intermodulation distortion), etc. Just don't assume that an amplifier with lower THD than another will necessarily sound better. Let's first do it the wrong way, even though it appears intuitive. (Follow along with your calculator if you really want to understand what's going on here.) You've got a sine-wave generator at, say, 400 Hz. at the input of your amplifier, and set it so that it outputs 4 volts RMS into an 8-ohm load. You correctly compute the power into the load (using the formula P=E2/R) as 4*4/8 = 2 watts. Let's say you measure the second harmonic at 0.3 volts RMS, and the third harmonic at 0.5 volts. For the sake of this discussion, let's assume that all other harmonics are way in the mud and can be neglected. It doesn't take long to add 0.3 and 0.5 (=0.8), divide by 4 volts, and multiply by 100 to come up with an apparent THD of 20%. However, this answer is incorrect. The reason is that we have to add Power and convert to an equivalent voltage. Let's do it the proper way, as summarized in the table below: |
| Harmonic | Voltage | Power | % Distortion |
| Fundamental | 4.0 volts | 2 watts | |
| 2nd Harm. | 0.3 volts | .01125 W | 0.56225 % |
| 3rd Harm. | 0.5 volts | .03125 W | 1.5625 % |
| Total | .0425 W | 2.12475 % |
| "Hey, neat," you may be saying. "Only 2.12475%!" But we're not there yet; 2.12475% is another wrong answer. While this apparent THD figure is, indeed, representative of the total power of the harmonic content, we still have to convert this power to an equivalent RMS voltage in order to come up with a THD figure according to standard methodology. So the correct answer is obtained by taking total harmonic power (0.0425 watts) and calculating the equivalent RMS voltage, given by the square root of power times output impedance, or about 0.583 volts in the example. i.e. SQRT(0.0425 watts * 8 ohms). So the THD value, as specified would actually be 100 times 0.583 volts divided by 4 volts = about 14.6% (correct answer). To generalize this as an equation,
where TDH(%) is total harmonic distortion, P represents the power of each harmonic, Zout equals the load impedance, and Vt is the total RMS output voltage (containing both the fundamental and the harmonic terms). Another way of getting the correct answer would be to take the square root of the sum of the squares of harmonic component voltages. This is because power is proportional to the square of the voltage. Let's try it. SQRT(0.32 + 0.52) = SQRT(.09 + .25) = SQRT(0.34) = 0.583. Multiply by 100 (to get percent) and divide by 4 (fundamental voltage) gives the same correct result, approx. 14.6%. In equation form,
where TDH(%) is total harmonic distortion, V represents the RMS voltage of each harmonic, and Vt is the total RMS output voltage. Note that Zout is not present in this variant of the equation; since P = V2/Z, the impedance terms cancel. |
| Working from a Spectrogram |
| The above approach is quite workable if you have, say, a tunable filter and RMS-calibrated voltmeter or oscilloscope with which you can get the harmonic distortion voltages. However, in this day and age, it's usually easier, cheaper and possibly more accurate to use an FFT spectrograph program to analyse your output signal. A typical output graph (describing the harmonic distortion behaviour of my RA-100 amplifier with new Tesla/JJ tubes) is shown below: |
 |
| I find this visual approach much more informative than a single THD number, since the relative strength of each harmonic is clearly illustrated; also, other relationships become readily apparent, such as (in this case) the attenuation of even harmonics because of the circuit's push-pull design. But for the sake of comparison (e.g. with similar designs) how would you derive the TDH% figure from the graph? Doing it by hand would be even more tedious than the earlier examples, since relative output is generally shown in decibels. So for each harmonic, you would have to compute first the power represented by each component, then derive the voltage, and finally do the "square root of the sum of the squares" thing to come up with a single THD figure. So why not put your computer to work for this also? I've worked up a simple spreadsheet, which you can download either in Excel (thd.xls) orLotus 1-2-3 (thd.wks) format. When you open the spreadsheet, you'll see this: |
 |
Both "instances" operate independantly, so you can easily do side-by-side comparisons of two sets of data (as, in this case, between the RA-100 at 12 watts and at 54 watts). To use this, first normalise your wave so that the peaks reach 100 percent, then do a FFT spectrum analysis. The result will be a graph similar to those shown here. Finally, read off the decibel values of each harmonic, and enter them into the appropriate cells in the "dB"column of the spreadsheet. For values that are "off the graph" enter some absurdly low dB value (e.g. -100) and the resultant computation for that harmonic will be negligible (unless you have a really really good amp!) ;-) As an aside, it should be noted that your graphs will normally show the fundamental at slightly less than 0 dB, even if you first normalised your output wave to 100%. This is not an error in your program (for instance "CoolEdit"), it is due to the fact that the harmonic content effectively subtracts from the fundamental power. You can have a look at the formulae in the "Power" columns and "Totals" rows if you want to understand what's going on here. I hope that some of you will find this useful. |
To understand a system with an input and an output, such as an audio amplifier, we start with an ideal system where the transfer function is linear and time-invariant. When a signal passes through a non-ideal, non-linear device, additional content is added at the harmonics of the original frequencies. THD is a measurement of the extent of that distortion.
When the input is a pure sine wave, the measurement is most commonly the ratio of the sum of the powers of all higher harmonic frequencies to the power at the first harmonic, or fundamental, frequency:

which can equivalently be written as
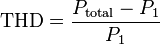
if there is no source of power other than the signal and its harmonics.
Measurements based on amplitudes (e.g. voltage or current) must be converted to powers to make addition of harmonics distortion meaningful. For a voltage signal, for example, the ratio of the squares of the RMS voltages is equivalent to the power ratio:

where Vn is the RMS voltage of nth harmonic and n=1 is the fundamental frequency.
THD is also commonly defined as an amplitude ratio rather than a power ratio,[1] resulting in a definition of THD which is the square root of that given above:

This latter definition is commonly used in audio distortion (percentage THD) specifications. It is unfortunate that these two conflicting definitions of THD (one as a power ratio and the other as an amplitude ratio) are both in common usage.
As a result, THD is a non-standardized specification and the results between manufacturers are not easily comparable. Since individual harmonic amplitudes are measured, it is required that the manufacturer disclose the test signal frequency range, level and gain conditions, and number of measurements taken. It is possible to measure the full 20–20 kHz range using a sweep. For all signal processing equipment, except microphone preamplifiers, the preferred gain setting is unity. For microphone preamplifiers, standard practice is to use maximum gain.
Measurements for calculating the THD are made at the output of a device under specified conditions. The THD is usually expressed in percent as distortion factor or in dB relative to the fundamental as distortion attenuation.
[edit]THD+N
THD+N means total harmonic distortion plus noise. This measurement is much more common and more comparable between devices. It is usually measured by inputting a sine wave, notch filtering the output, and comparing the ratio between the output signal with and without the sine wave:
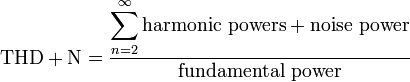
A meaningful measurement must include the bandwidth of measurement. This measurement includes effects from intermodulation distortion, and so on, in addition to harmonic distortion. In Europe, it is preferable to apply a ITU-R BS.468 weighed curve, which is intended to accentuate what is most audible to the human ear, contributing to a more accurate measurement. However, as the weight of the curve adds 12 dB of gain to the critical midband, making THD+N measurements bigger, manufacturers object to its use and have widely prevented its adoption in American and Asian markets.
Tidak ada komentar:
Posting Komentar